Mapping Cultures in the Big Tent - Multidisciplinary Networks in the Digital Humanities Quarterly
Authors
| Name | Profession | Affiliation |
|---|---|---|
| Dulce Maria de la Cruz | Freelance Data Analyst | - |
| Kristin Lewis | Physicist | AAAS |
| Teh-Hen Yu | IT Professional | - |
| Jake Kaupp | Engineering Education Researcher | Queen’s University |
| Max Kemman | PhD Candidate | University of Luxembourg |
About the Project
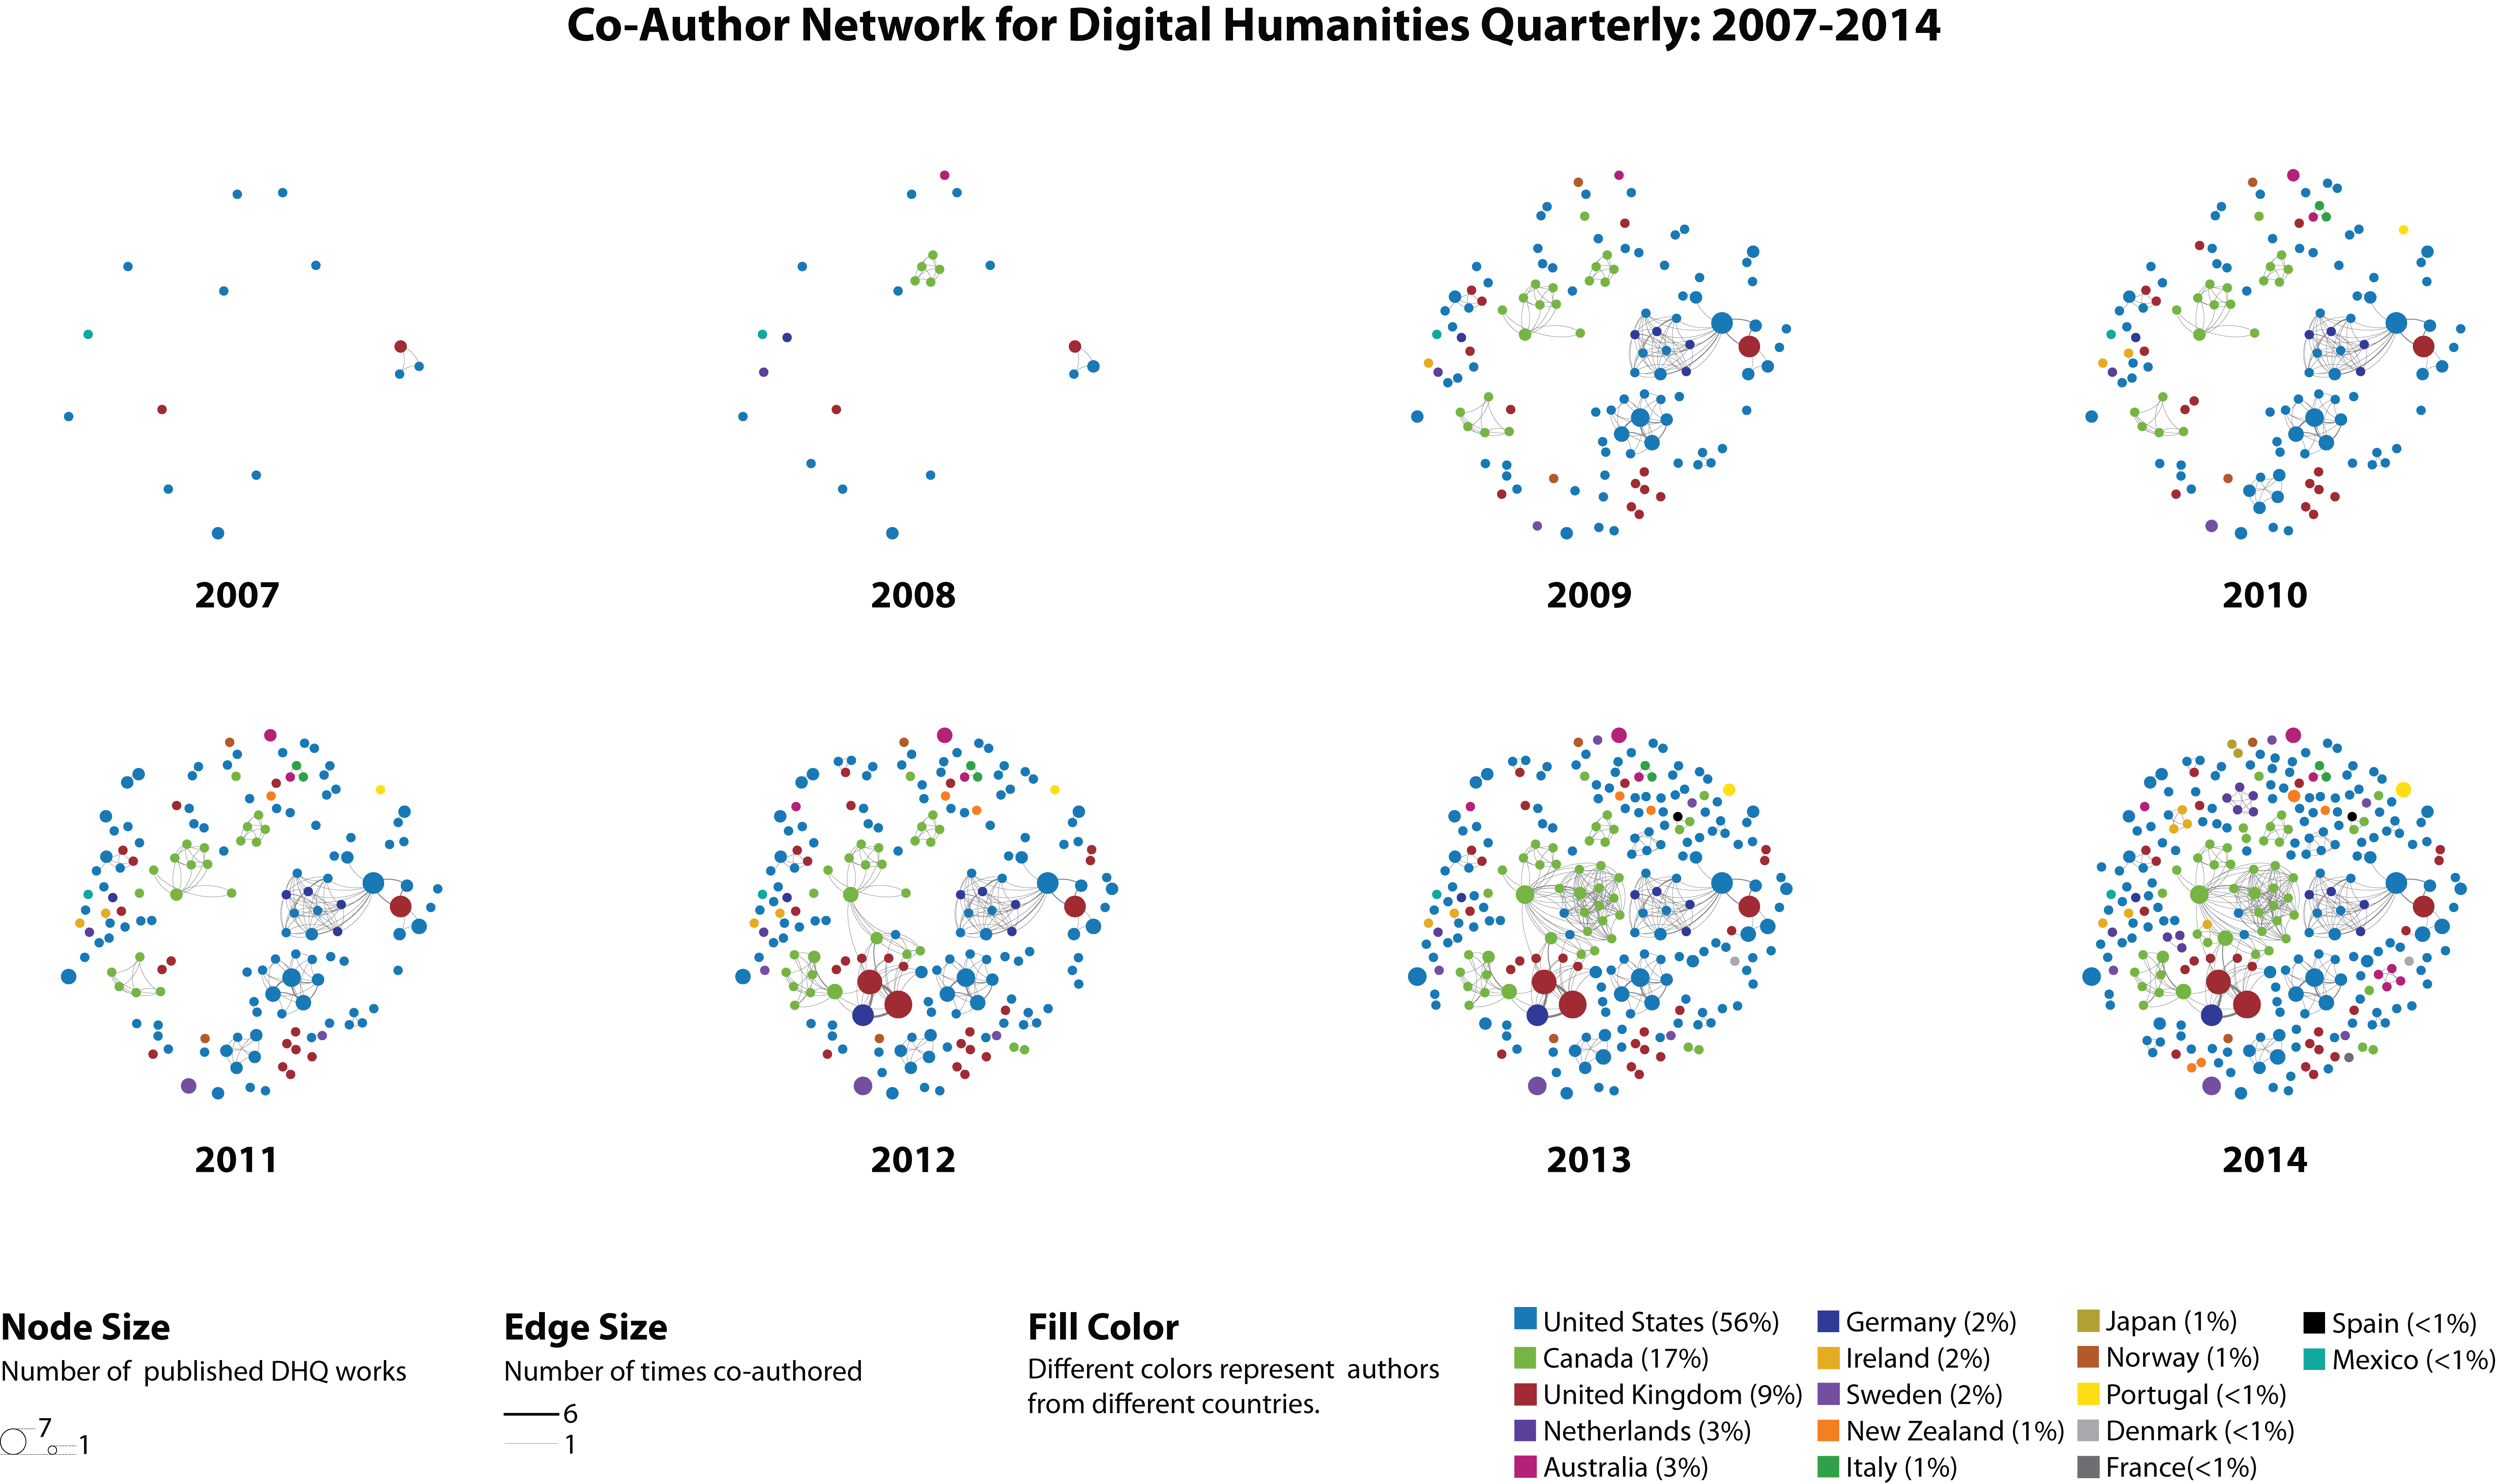
The Digital Humanities Quarterly (DHQ) journal covers all aspects of digital media in the humanities, representing a meeting point between digital humanities research and the wider humanities community (Alliance of Digital Humanities Organizations, 2005). It is the publication from ACH (Association for Computers and Humanities), which is part of ADHO (the Alliance of Digital Humanities Organization) – a global alliance with constituent members in EU (EADH), US (ACH), Canada (CSDH/SCHN), Japan (JADH), Australia (aaDH), and an international network (centerNet) with 196 Digital Humanity Centers globally. Articles published in DHQ involve authors of multiple countries, institutions and disciplines who work on several subjects and areas related to digital media research.
Under a recent grant from NEH (National Endowment for Humanities), DHQ has developed a centralized bibliography which supports the bibliographic referencing for the journal. The client is looking for visualizations that show:
- how citations reflect differences in academic culture at the institutional and geographic level
- the changes to that culture over time.
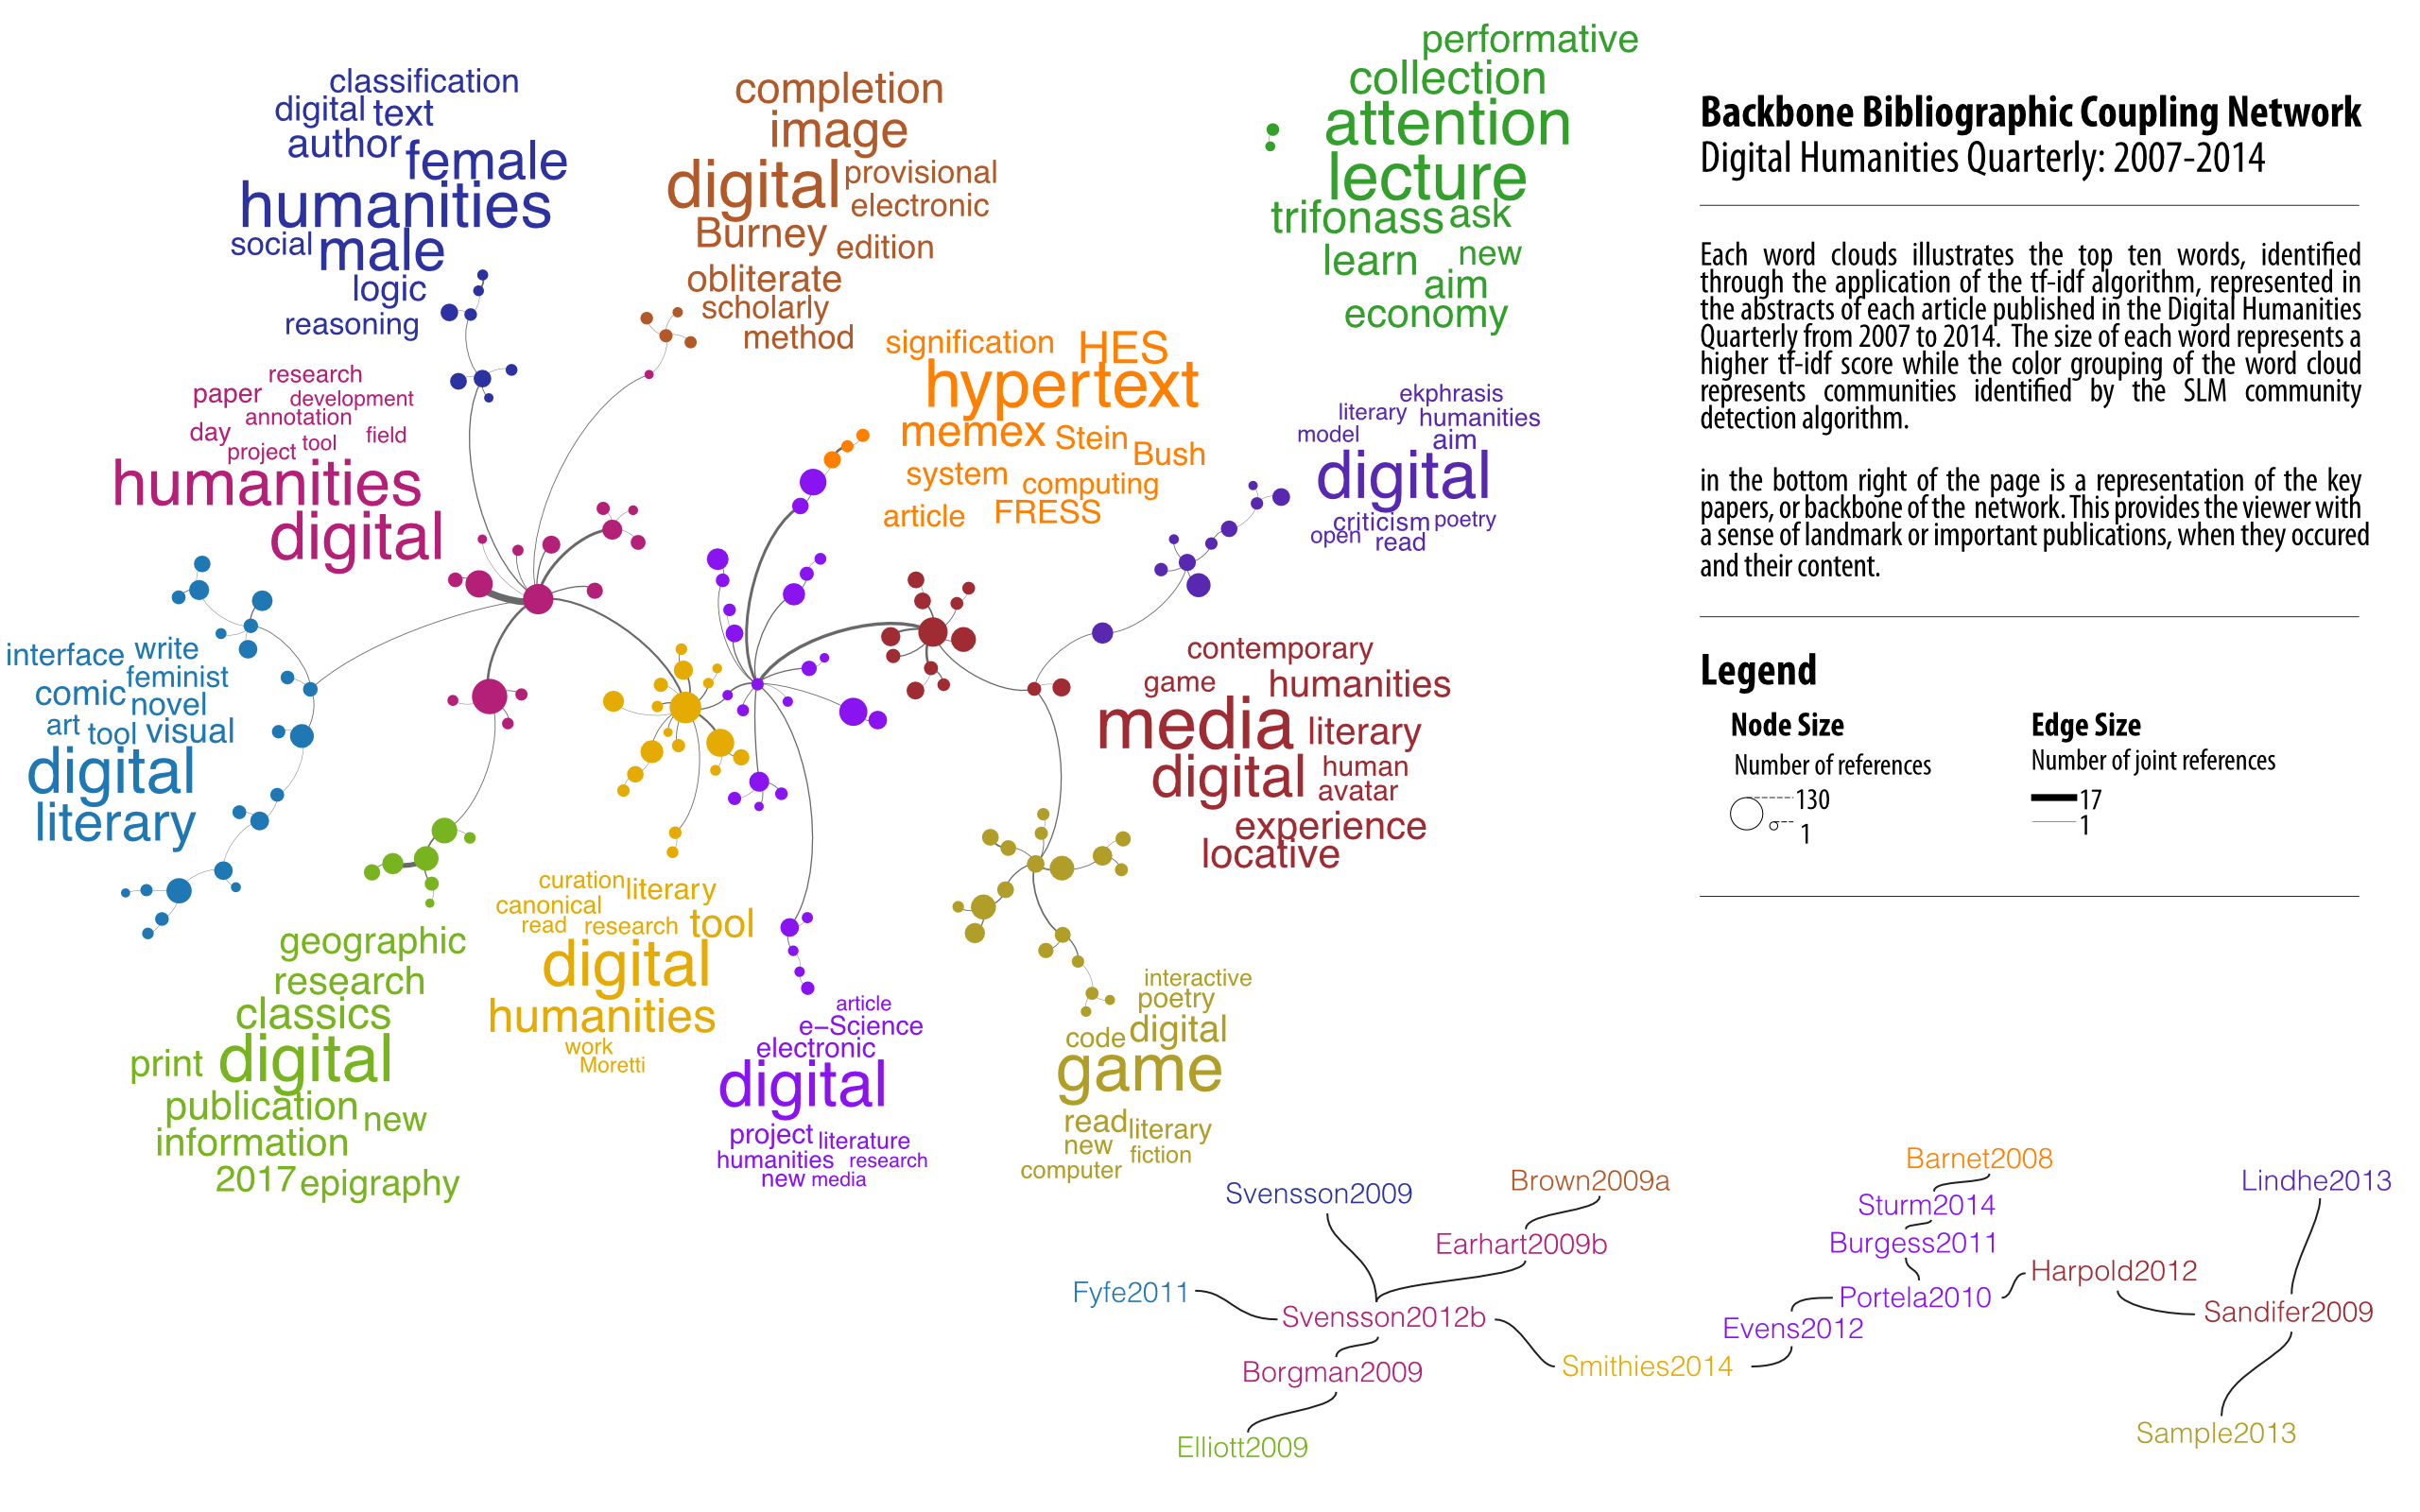
- correlations between article topics (reflected in keywords) and citation patterns.
The identification of those subjects and areas and of their major contributors would be very important for any researcher involved or interested in digital media research. However, due to the collaborative, multidisciplinary nature of the digital media research, such identification becomes extremely difficult, if not impossible, to accomplish by merely analyzing the DHQ bibliographic database (Borner, 2003). In such a case, visualization is the preferred approach.
IVMOOC Project Deliverables
- User and Task Analysis
- Presentation of Project Plans
- Presentation of Intermediate Project Results
- Peer Feedback
- Final Project Paper
Project Repository
Most of the work was done collaboratively using a variety of tools and approaches. Early on, the group decided to keep a record of all work for the project on github. This website is the project page for the github repository and contains the project deliverables as well as:
Data Wrangling & Analysis
This section outlines the tools and workflows used for the data wrangling (collection, completion, cleaning and validation) and the subsequent analysis and visualization of the data. Where possible, we have included workflows to aid in reproducing our work.
Source & Master Data Files
This section provides an brief outline of the data provided by the client, as well as additional data gained from cleaning and validation. It also contains the descriptions of the master files used for analysis and visualization.
Images
This contains all of the preliminary images, draft visualizations, sketches and drawings developed by the group. These represent the collective efforts of the group to arrive at the final visualizations presented in the project report.
- Test Images
- Intermediate Visualizations
- Final Test Visualizations
- Final Visualizations
- Final Visualizations (PDF & AI)
There is also a flickr album which showcases all of the visualizations presented in the final report.

This work is licensed under a Creative Commons Attribution-NonCommercial-NoDerivatives 4.0 International License.